The spectrogram
This page will NOT go into detail on how to read a spectrogram by itself, for this I can recommend the following video by Zheanna from TransVoiceLessons on YouTube.
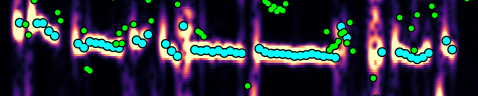
Here is an example screenshot of the spectrogram canvas after speaking into the microphone.

The canvas consists of a classic spectrogram, on top of which pitch estimates and resonance tracks are overlaid.
Graph axes#
The horizontal axis indicates the time in seconds.
Pausing the analysis will cause the time axis to stop progressing.
The vertical axis indicates frequency in Hertz.
The scale is set to ERB by default, it is a non-linear frequency scale that is modelled after human psychoacoustics.
Frequency tracks#
InFormant displays various frequency tracks as dots of different colours. The latest version as of writing this documentation (3.0.2) does not allow customisation of those colours.
Pitch, Fo#
The cyan track represents your estimated pitch.
These pitch estimation algorithms are only correct within a certain frequency range, usually somewhere between 60 and 600 Hz.
R1, R2, R3#
The three other tracks represent your estimated resonances.

They are always ordered by frequency, which is not always correct from a semantic point of view.